LE STORYTELLING de Sephora Panchbaya
Passionnée par l’analyse de données, à la recherche d’un stage et investie dans un projet très innovant au sein de son école, sa candidature a très rapidement retenu notre attention. Aucun regret! Nous avons partagé ces derniers mois à ses côtés…pépite !
Elle vous en dit plus :
À la sortie de mon BAC S, j’ai fait une première année de cours préparatoires en mathématiques et physique dans l’optique de devenir ingénieure. Un an après, j’ai réalisé que les cours théoriques ne me convenaient plus et que je voulais faire autre chose.
Je me suis donc dirigée vers Epitech, une école en 5 ans qui forme des experts en technologies de l’information et je me suis orientée vers le développement de jeux vidéo. Après la première année, je me suis rendu compte que ce monde n’était pas pour moi non plus.

Ayant un fort attrait pour les mathématiques et les statistiques, j’ai pendant longtemps cherché ce que je pourrai faire dans l’avenir.
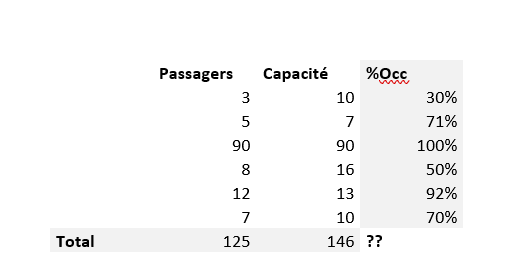
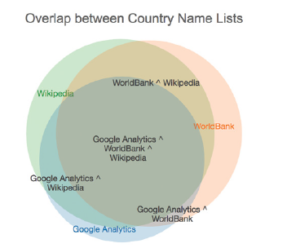
Je me suis donc penchée sur le domaine de l’analyse de données. J’ai toujours trouvé fascinant tout ce qui pouvait être révélé lorsque l’on prenait le temps de comparer et d’analyser des données. Cependant, il est aussi facile de les manipuler pour leur faire dire ce que l’on souhaite.
Pour pouvoir me conforter dans cette idée, j’ai souhaité réaliser un stage au cœur de ce domaine pour ma 3e année. C’est là que j’ai rencontré Datanalysis, une petite entreprise réunionnaise et à fond dans l’innovation.
Durant les 4 mois qui ont suivi, j’ai pu m’intégrer très vite à leur équipe, découvrir leur monde et ce qu’ils y font.
J’ai pu réaliser diverses missions en interne qui m’ont permis d’acquérir énormément de connaissances dans ce domaine en peu de temps et de manière autonome. J’ai par exemple, appris à maîtriser Tableau Software, un outil majeur dans la visualisation de données mais également plein d’autres outils qui me seront très utiles dans l’avenir.
A la suite de ce stage, je m’envolerai vers une université d’Irlande pour me spécialiser dans la Data Analytics !